UPA vs NDA 2004-14 vs 2014-24 critique of the graphic posted by the India Today
Comparing HDI Values
India Today has published a graphic comparison of selected indicators during UPA regime and NDA regime. According to the graphic describing performance of Human Development Index for India during the two regimes, the NDA regime has registered better HDI value than UPA regime.
Graphic has taken a ten-year average of India’s HDI score from 2004 to 2014, this is 0.566182, comparative average for the NDA during 2014-2022 is 0.631667. It is curious, that India Today used average of the indexed values to compare performance of the index over a period, instead of comparing the actual HDI values.
Choice of taking simple average of the HDI values during UPA and NDA years, churns out numbers such that on the human development front, NDA 2014-22, appears to have performed better than the UPA 2004-14.
Comparision of Index numbers over time
Should one take a simple average of the index numbers to compare the performance of this index over a period? One should not, the average of index values is not typically used to compare index numbers over a time.
Source of data used to write this article is available by clicking this link
data was downloaded as a CSV file, on June 01, 2024
Instead of looking at the average value of HDI over the years, if we consider the difference in the values of HDI in 2004, 2014 and 2022. Data for 10 years is available for UPA. But for NDA it is available for only 8 years. Hence, here is a comparison of 8 years of UPA vs. NDA, as well as 10 years of UPA with NDA’s 8 years.
India UPA 2004-14 vs NDA 2014-2022 HDI Values
|
Year |
India UPA 2004-14
vs NDA 2014-2022 HDI Values |
|||
|
HDI Value |
Increase in HDI (Difference
between the Latest year value and the Previous year Value) |
|||
|
2004-2014 |
2014-2022 |
2004-2012 |
||
|
2004 |
0.523 |
|
|
|
|
2014 |
0.611 |
0.088 |
|
|
|
2022 |
0.644 |
|
0.033 |
|
|
2012 |
0.594 |
|
|
0.071 |
This table indicates that during UPA’s regime India’s HDI improved from 0.523 in 2004 to 0.611 in 2014, an increase of 0.088 points. HDI improved from 0.611 in 2014 to 0.644 in 2022, and improvement of 0.033 points during eight years of NDA’s regime. India’s HDI improved from 0.523 in 2004 to 0.594, in 2012 i.e., by 0.071 points, during eight years of UPA.
UPA vs. NDA: Human Development Index Performance
For the eight years of UPA regime, from 2004 to 2012, HDI value increased by 0.071 points.
For the eight years of NDA regime, from 2014 to 2022, HDI value increased by 0.033 points.
India’s value of HDI has increased greater during the years when UPA was in power, than the years during which the NDA was in power.
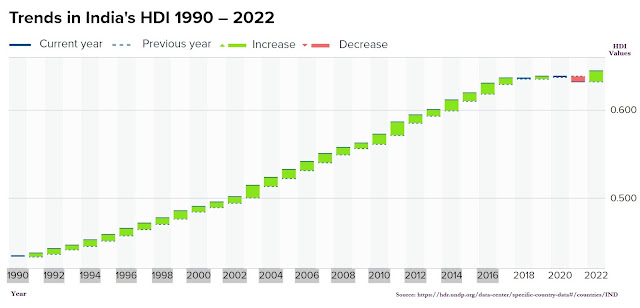
Trends in India's HDI 1990 -2022
The following graphic from UNDP, which illustrates values of India’s HDI from 1990 onwards, is worth a look, to get clear picture.
This graph shows the curve of HDI of India from 1990 onwards, till year 2022, the latest year for which the data is provided by UNDP for India.
This curve is sharply rising from 1990 till 2014. From 2014 to 2022, there are ups and downs. Decline in the value of the HDI in year 2021 is explained by COVID19 pandemic. There is a flat section in the curve from 2017 to 2021, indicating that there was very little of no change in the value of the HDI, compared to the previous year.
For 25 years, from 1990 to 2014, there is no observance of flattening of the curve, as far as value of the HDI is concerned. Though there was a period of slightly steady growth while the absolute value of HDI was increasing during 2004 to 2006.
Proper look at the year-on-year change in the absolute value of HDI gives us a clearer picture of the situation. This aspect of change in the value of the HDI from its immediately previous year’s value, is illustrated in the following graph. Difference between current year’s HDI and previous year's HDI is obtained from Idia’s HDI available from UNDP.
Volatile Performance on HDI during NDA
Above chart indicates India’s roller-coaster performance on human development from 2014 to 2022. During this eight-year period of NDA regime, the change in HDI score compared to its previous year has remained the same, at 0.011 points. In this period, we can see drastic ups and downs in the change in HDI score from the previous year, for India.
Such a high volatility was not observed during the UPA’s regime from 2004 to 2014. Under UPA’s term, change in HDI from previous year’s score was a minimum of 0.005 points to a maximum of 0.014 points (i.e., range is 0.009).
Under NDA’s eight-year period, change in the HDI from previous year’s score was a minimum of - 0.005 points to + 0.011 points (i.e., range is 0.016). These numbers reveal a much higher ups and downs during NDA’s governance in India.
Higher ups and downs hint towards a possible callousness in efforts towards improving human development indicators. In days of data churning, it takes little more effort to churn the real cream away from the fluff.


Comments